The soil profile across Portland changes dramatically depending on where you're standing. Over in the Alameda Ridge area you'll encounter the wind-deposited Portland Hills Silt — a loess that feels stable in dry August but turns to jelly after a week of November rain. Just a few miles east toward the Columbia Slough, the soil shifts to fine-grained floodplain clays with high plasticity, remnants of the Missoula Floods that shaped this entire basin. These two materials behave nothing alike under moisture change, which is exactly why we run Atterberg limits testing on nearly every project that involves cohesive soils. The liquid limit and plastic limit tell us whether a clay will heave, shrink, or lose bearing capacity when the water table fluctuates — and in Portland, with our 36 inches of annual rainfall, that fluctuation is a constant design challenge. Complementing the Atterberg classification with a grain size analysis gives us the full picture of the fines fraction, while a triaxial test becomes essential when the plasticity index suggests undrained strength may govern the failure mode.
A plasticity index above 20 in Portland basin soils is our first signal that volume change — not just bearing capacity — will control the foundation design.
Service characteristics in Portland Oregon
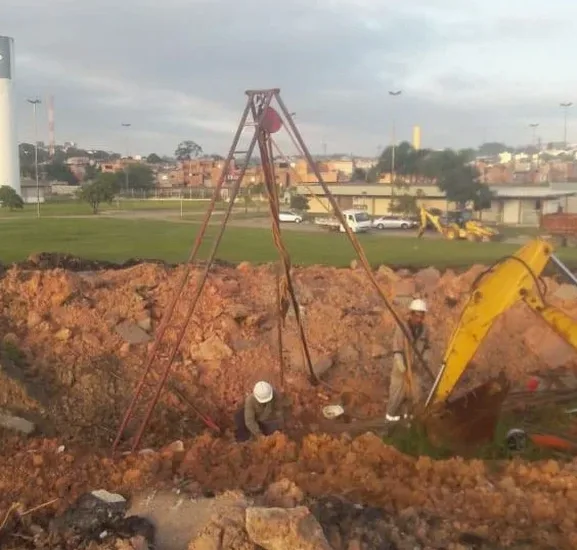
Local geotechnical conditions in Portland Oregon
The International Building Code (IBC), adopted by the City of Portland, references ASCE 7 for seismic design parameters and relies on soil classification per ASTM D2487 — a system where the Atterberg limits are the primary differentiator for fine-grained soils. In Portland's seismic design category D, misclassifying a high-plasticity clay (CH) as a low-plasticity silt (ML) has consequences that compound through every subsequent design decision. A CH soil on a sloped lot in the West Hills, for example, may undergo cyclic softening during a Cascadia earthquake, while an ML soil on the same slope might drain rapidly enough to resist pore pressure buildup. The difference between these two behaviors is captured in the liquid limit and plasticity index numbers that come out of our lab. We see this risk materialize most often on infill lots in close-in neighborhoods like Lents and Brentwood-Darlington, where older homes were built before modern geotechnical investigation standards existed and the underlying clay was never properly characterized. Getting the Atterberg classification right before the foundation design phase avoids the costly scenario of underpinning a settled structure five years after construction.
Our services
Our Atterberg limits testing integrates directly with the broader geotechnical investigation workflow for Portland projects. The plasticity data we generate feeds into foundation design, slope stability analysis, and pavement subgrade evaluation. Here is how the service typically fits into a project:
Atterberg Limits Classification (ASTM D4318)
Complete liquid limit and plastic limit determination on disturbed samples passing the No. 40 sieve, with plasticity index calculation and USCS classification per ASTM D2487. Turnaround within 3 business days for standard projects.
Correlative Testing Package
Combined Atterberg limits, natural water content, and grain size distribution on the same sample for a complete index property profile. We include the liquidity index and activity calculation when in-situ moisture data is provided.
Shrink-Swell Potential Assessment
Using the plasticity index and clay fraction data, we provide an engineering evaluation of volume change potential for Portland's expansive clays, with recommendations for moisture-conditioned fill or foundation depth adjustments.
Common questions
What do Atterberg limits tell me about my Portland building site?
The Atterberg limits — liquid limit and plastic limit — define the range of water contents over which a fine-grained soil behaves plastically. The plasticity index (LL minus PL) correlates directly with the soil's capacity to adsorb water and change volume. In Portland, where winter rains saturate the shallow soils and summer drought desiccates them, a high plasticity index on your site's clay means you'll likely need to account for shrink-swell movement in your foundation design, either by extending footings below the zone of moisture fluctuation or by removing and replacing the expansive material.
How much does Atterberg limits testing cost in Portland?
Atterberg limits testing typically ranges from US$50 to US$100 per sample when performed as part of a larger geotechnical investigation package. The exact cost depends on whether we're running both liquid limit and plastic limit, the number of samples, and whether correlative tests like grain size analysis are ordered simultaneously. We provide a line-item quote before any work begins so there are no surprises.
How long does it take to get Atterberg limits results?
Standard turnaround is 3 business days from the time the sample arrives at our lab. For fast-track projects with tight construction schedules, we can deliver results in 24 hours with a rush processing request. The actual testing procedure per ASTM D4318 takes several hours including sample preparation, the Casagrande cup procedure, and the plastic limit thread-rolling — plus overnight oven drying for water content determination.
What soil types require Atterberg limits testing?
Atterberg limits apply to fine-grained soils — silts and clays — where more than 50% of the material passes the No. 200 sieve. If your site in Portland has predominantly sandy or gravelly soils, the test is not applicable; instead, we'd focus on grain size distribution and relative density. However, many Portland-area soils contain enough fines that a small clay fraction can still control the engineering behavior, so we often run Atterberg limits on the minus-40 fraction even for soils visually classified as sandy silt.
How do Portland's local soils affect Atterberg limits results?
Portland's geology is dominated by Missoula Flood deposits — layered silts and clays that can vary dramatically over short vertical distances. The Portland Hills Silt, a loess found in the West Hills and along the Alameda Ridge, typically shows moderate plasticity with liquid limits in the 40-60 range. In contrast, the floodplain clays near the Columbia Slough and along the Willamette River often exhibit liquid limits above 70 and plasticity indices exceeding 30, classifying them as fat clays (CH) with high shrink-swell potential. Knowing which geologic unit your site falls within helps us interpret the Atterberg results in context.